

The use of statistical methods to approach the relationship between yields and meteorological variables has proliferated during the last decade. This is attributable to the increasing availability and improved quality of observed data, the development of computer tools that can handle big data sets, and the adoption of new observation techniques, such as remote sensing. Schlenker and Roberts (2009) is a prominent example of this stream of literature. Lobell et al. (2010) claim that, under certain circumstances, this approach would beat the explanatory and forecasting performance of traditional (process-based) crop models.
Comparison of meteorological and satellite-based drought indices as yield predictors of Spanish cereals
with Sergio Contreras and Johannes Hunink (FutureWater). Agricultural Water Management, 213, 388-396.
In the context of global warming, as drought episodes become increasingly frequent, it is crucial to accurately measure the impacts of droughts on the overall performance of agrosystems. This study aims to compare the effectiveness of meteorological drought indices against satellite-based agronomical drought indices as crop yield explanatory factors in statistical models calibrated at a local scale. The analysis is conducted in Spain using a spatially detailed, 12-year (2003-2015) dataset on crop yields, including different types of cereals. Yields and drought indices were spatially aggregated at the agricultural district level.
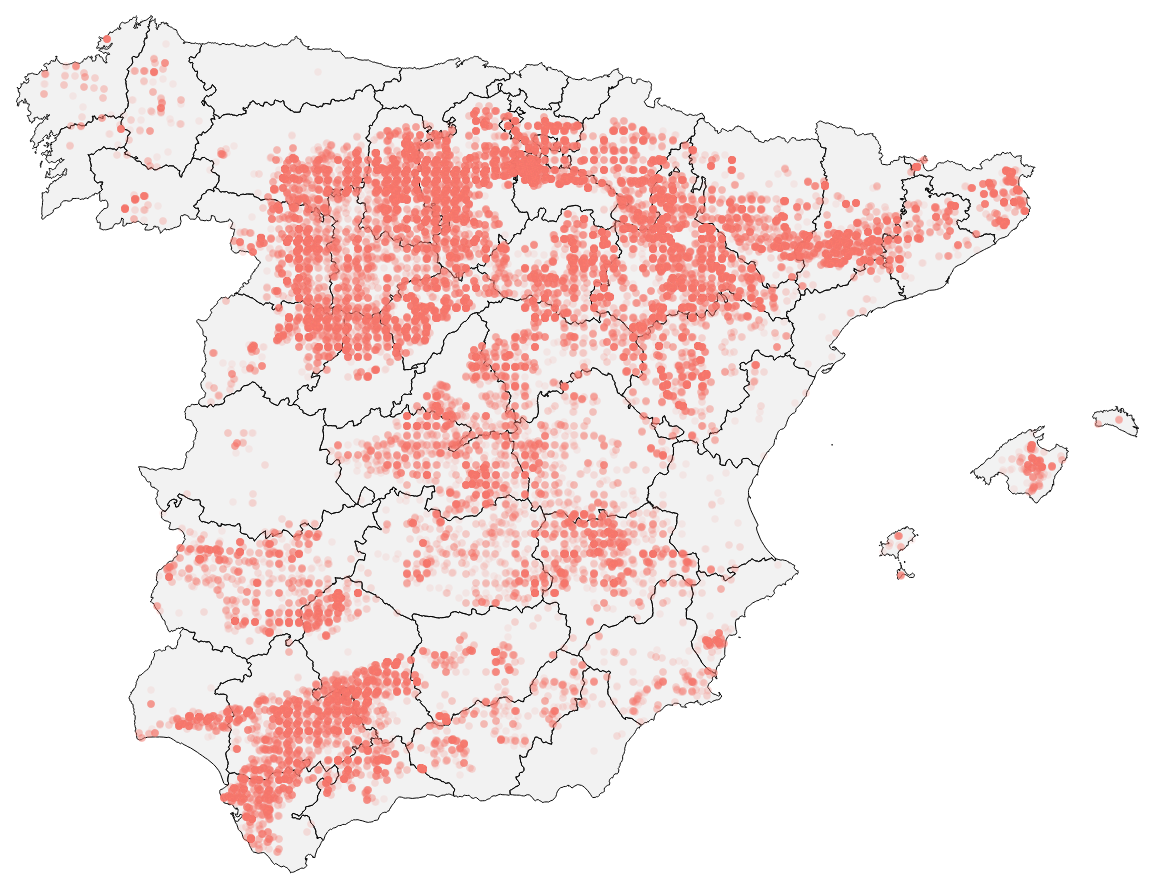
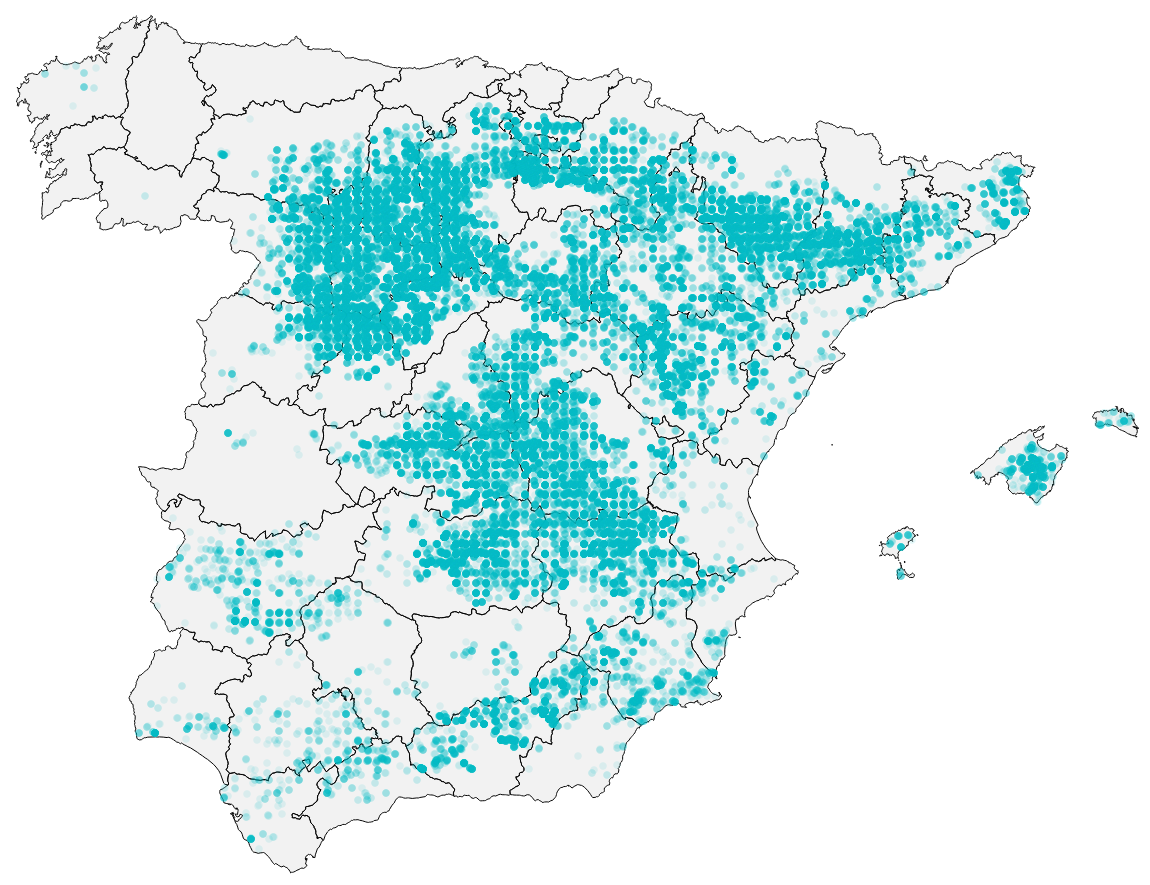
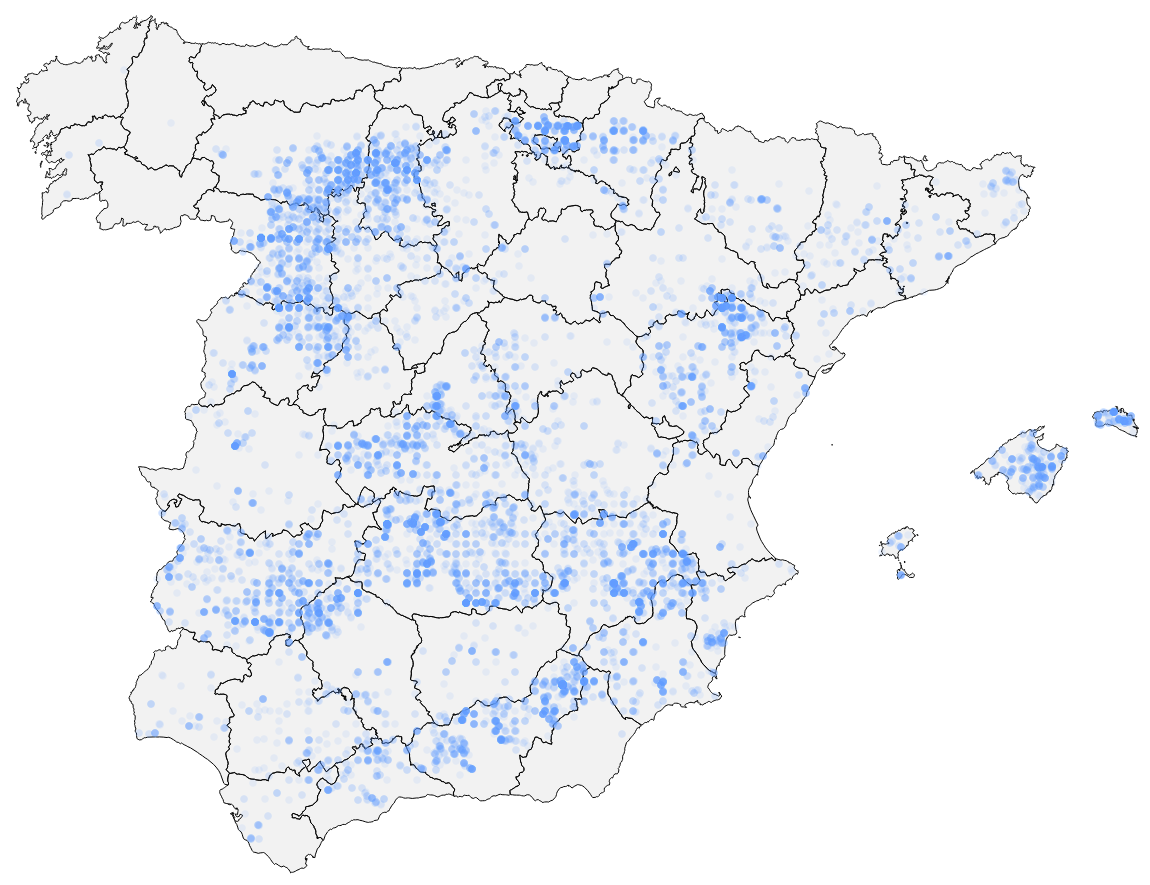
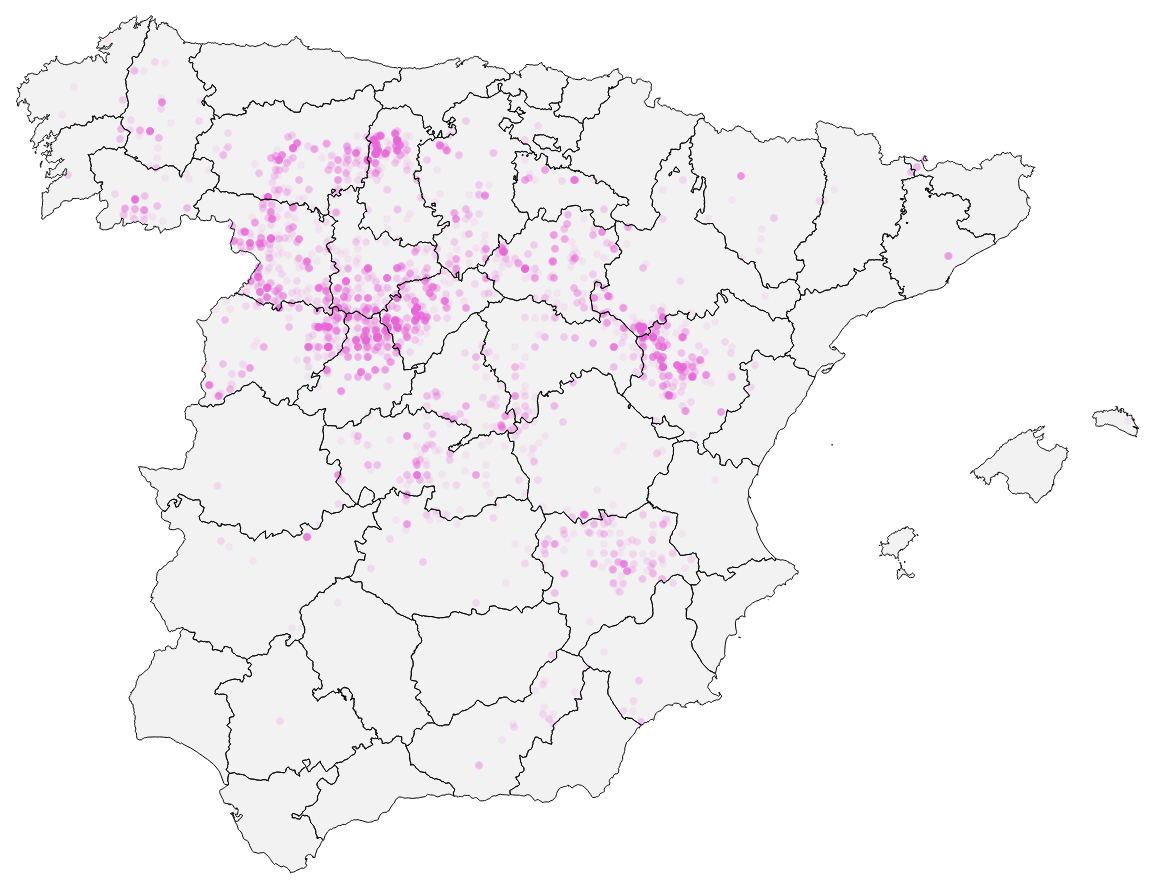
The Standardised Precipitation Index (SPI), computed at different temporal aggregation levels, and two satellite-based drought indices, the Vegetation Condition Index (VCI) and the Temperature Condition Index (TCI), were used to characterise the dynamics of drought severity conditions in the study area. Models resting on satellite-based indices showed higher performance in explaining yield levels as well as yield anomalies for all the crops evaluated. In particular, VCI/TCI models of winter wheat and barley were able to explain 70% and 40% of annual crop yield level and crop yield anomaly variability, respectively. We also observed gains in explanatory power when models for climate zones (instead of models at the national scale) were considered. All the results were cross-validated on subsamples of the whole dataset and on models fitted to individual agricultural districts and their predictive accuracy was assessed with a real-time forecasting exercise.
Results from this study highlight the potential for including satellite-based drought indices in agricultural decision support systems (e.g. agricultural drought early warning systems, crop yield forecasting models or water resource management tools) complementing meteorological drought indices derived from precipitation grids.
Local-scale cereal yield forecasting in Italy: Lessons from different statistical models and spatial aggregations
with Raúl López (INRAE), Andrea Toreti and Mateo Zampieri (Joint Research Centre-European Commission). Agronomy, 10(6), 809.
The goal of this research project is to advance in describing the role of methods and indicators in the estimation of local level statistical crop models. A set of different meteorological and remote sensing drought indicators as explanatory factors of rainfed crop yields will be considered. The optimal level of spatial aggregation of weather and agricultural data will be explored. On top of classical regression techniques in predicting crop yields, recently proposed regularisation methods will also be explored.
Data
Weather and Remote Sensing data
-
Meteorological variables (temperature, precipitation) from the UERRA-HARMONIE gridded dataset.
-
SPEI at different time steps computed from the above variables.
-
fAPAR from Copernicus. Indicator on crop photosynthetic activity.
-
Actual evapotranspiration from MODIS. This product provides global ET at 1km spatial resolution in 8-days composites. The estimation of ET is based on the energy balance approach.
-
Superficial soil moisture from radar imagery. It is available since 1979 up to present and the SSM is estimated through a combination of passive and active radar sensors. The spatial resolution is 0.25 degrees (approx. 25 km).
-
Land Surface Temperature (LST), from thermal imagery. This product is available since 1981.
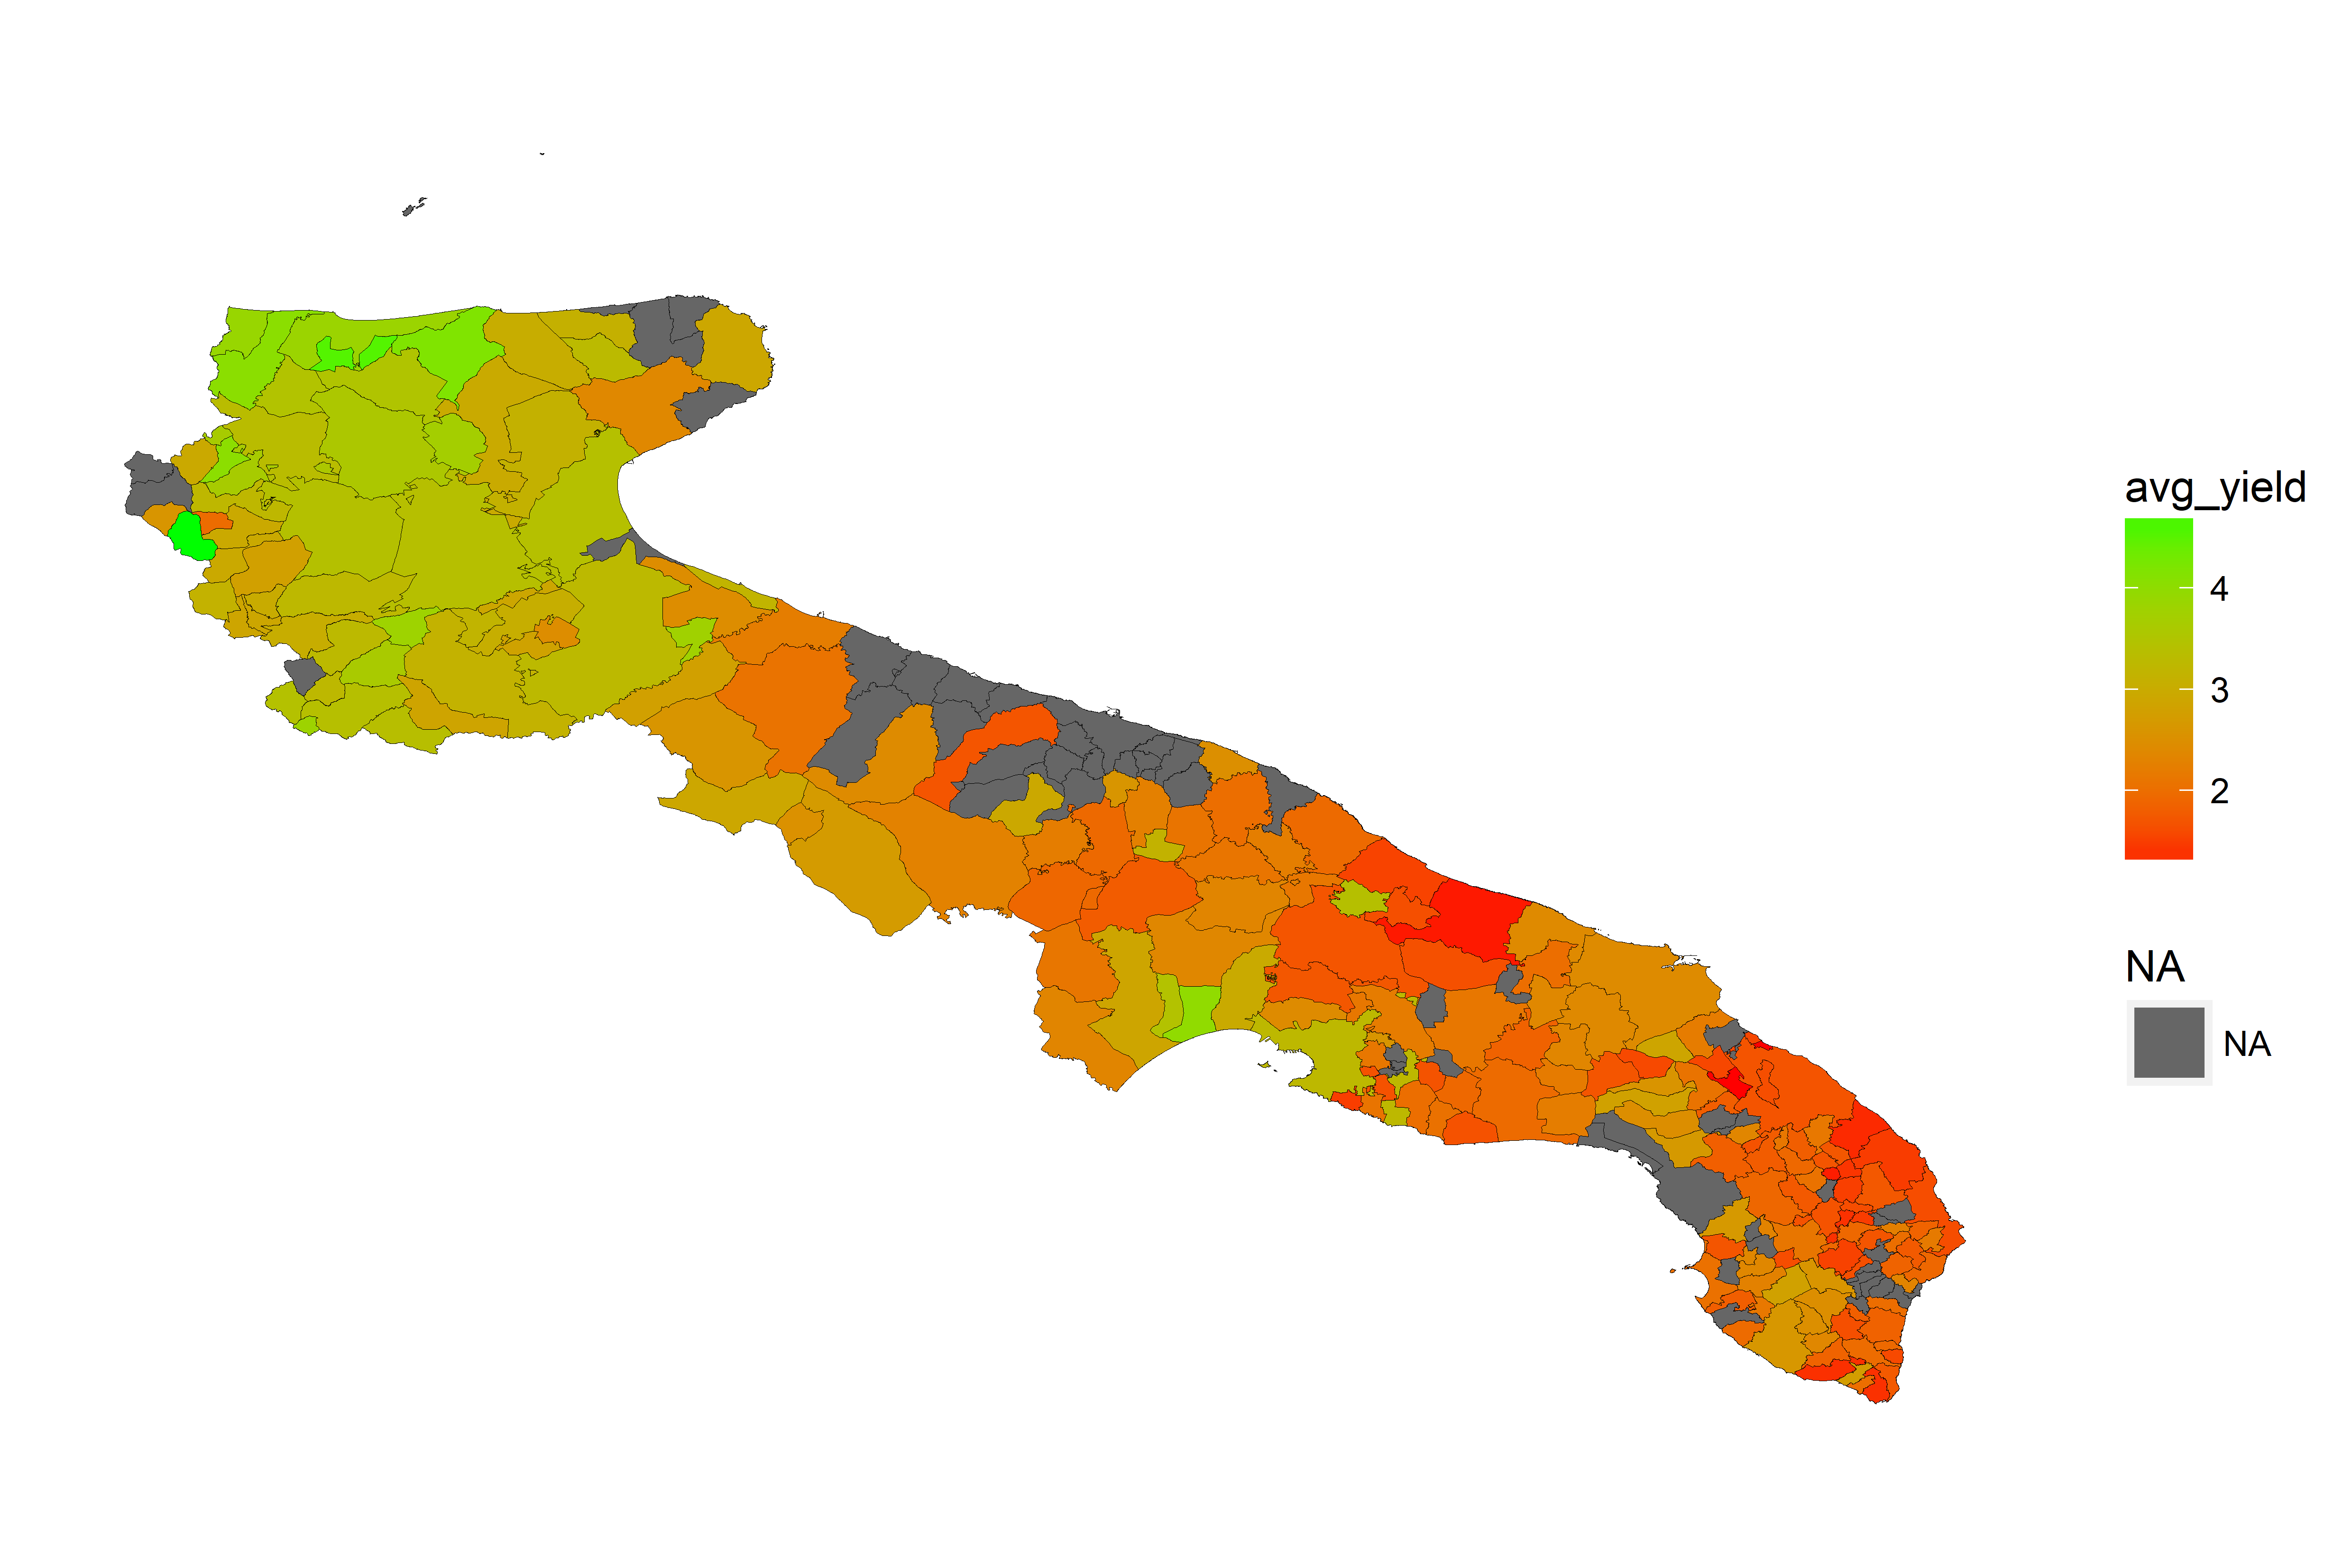
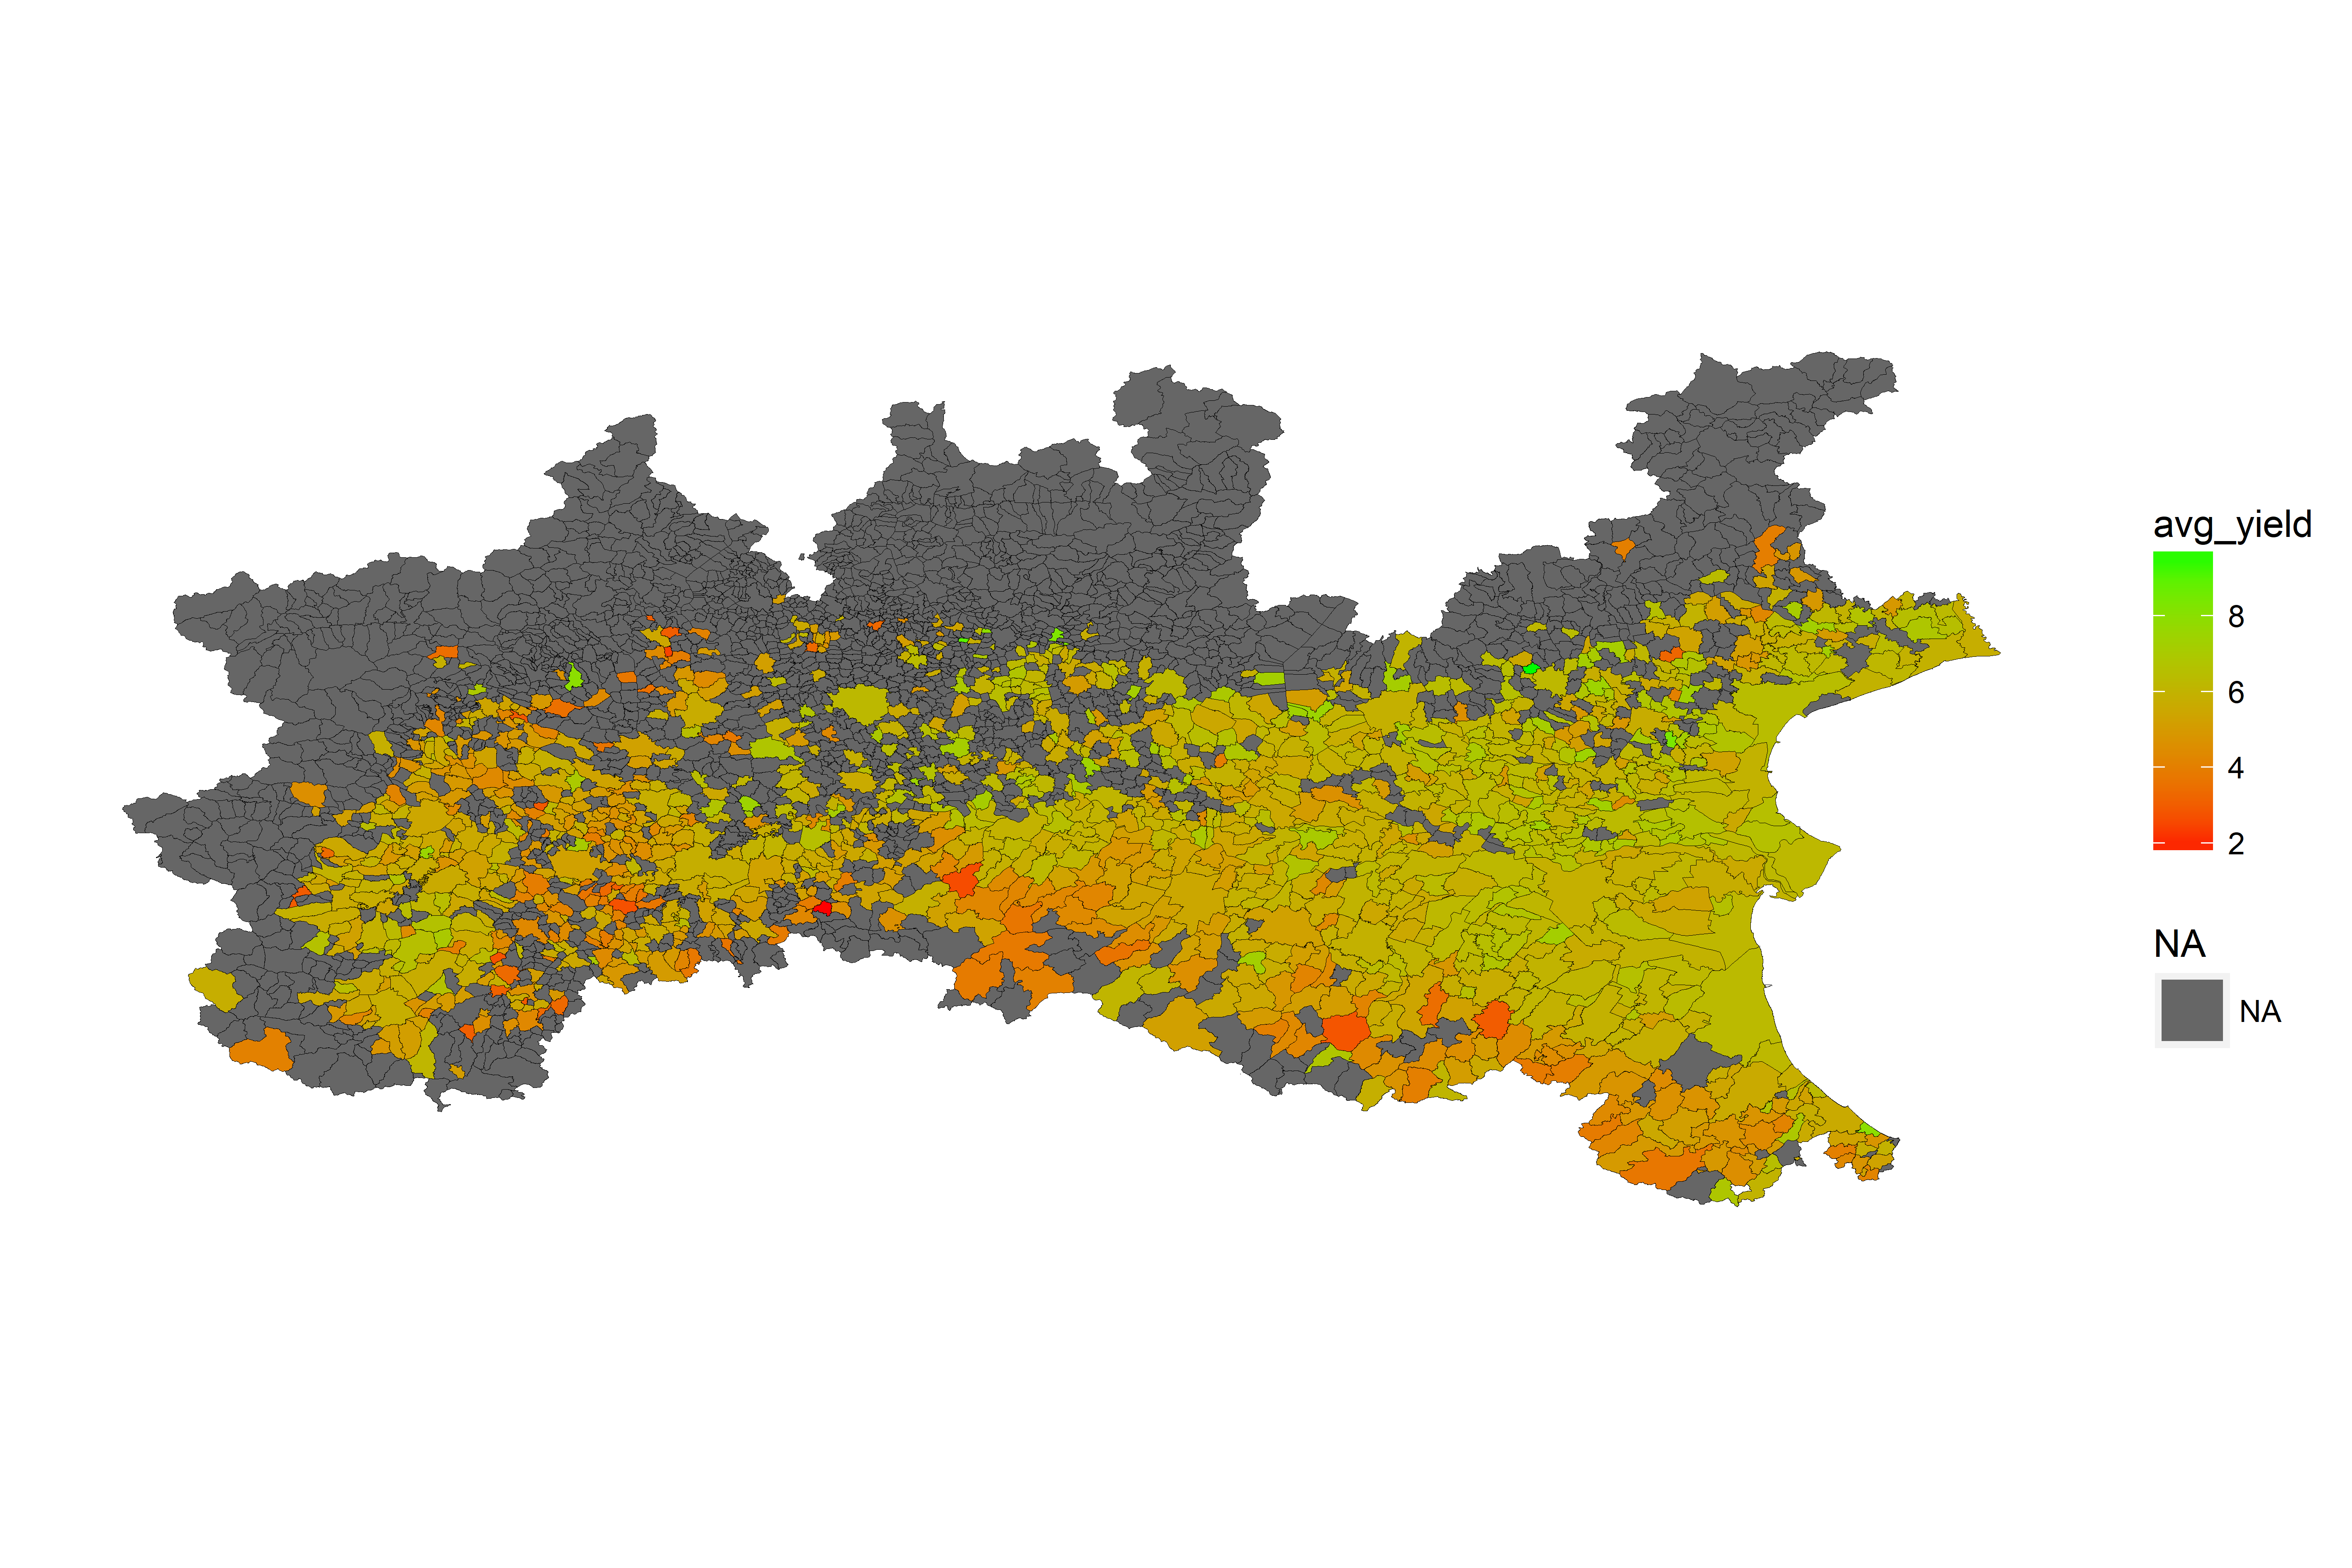
Yield data. RICA dataset on farm-level, georeferenced yield and other agricultural variables over Puglia and the Po Valley.
Methods
Sharif et al. (2017) applied with success regularisation techniques to local level crop models of oilseed rape. We extend here on their methodology by applying classical and regularisation methods to different crops and agro-climatic regions.
Our benchmark empirical crop model reads
\[log(yield_{i})= \beta_{00} + \beta_{01}\cdot \text{Year}_i + x_i^T\beta + \epsilon_i\]where the following expression is minimised
\[\underset{\alpha,\beta}{\mathrm{min}}\left(\frac{\text{RSS}}{2N} + \lambda \left[\frac{1-\alpha}{2}\left\lVert \beta \right\rVert^{2}_{2} + \alpha\left\lVert \beta \right\rVert_{1} \right]\right)\]and
\[\text{RSS}=\sum\limits_{i=1}^N (log(yield_i)-\beta_{00} - \beta_{01}\cdot \text{Year}_i - x_i^T\beta)^2\]where \(\beta_0=\{\beta_{00},\beta_{01}\}\) is a vector of not penalised parameters, \(\left\lVert \beta \right\rVert^{2}_{2} = \sum_{j=1}^{k} \beta_j^2\) and \(\left\lVert \beta \right\rVert_{1} = \sum_{j=1}^{k} \mid\beta_j\mid\). The hyperparameter \(\lambda\) is chosen through cross-validation. Accounting for the co-linearities between heat stress and drought. over a grid of values of lambda covering the entire range. Assuming gaussian errors, the negative log-likelihood contribution for observation \(i\). The elastic-net penalty is controlled by \(\alpha\), and bridges the gap between lasso (\(\alpha=1\), the default) and ridge (\(\alpha=0\)). The tuning parameter \(\lambda\) controls the overall strength of the penalty.
Conclusions
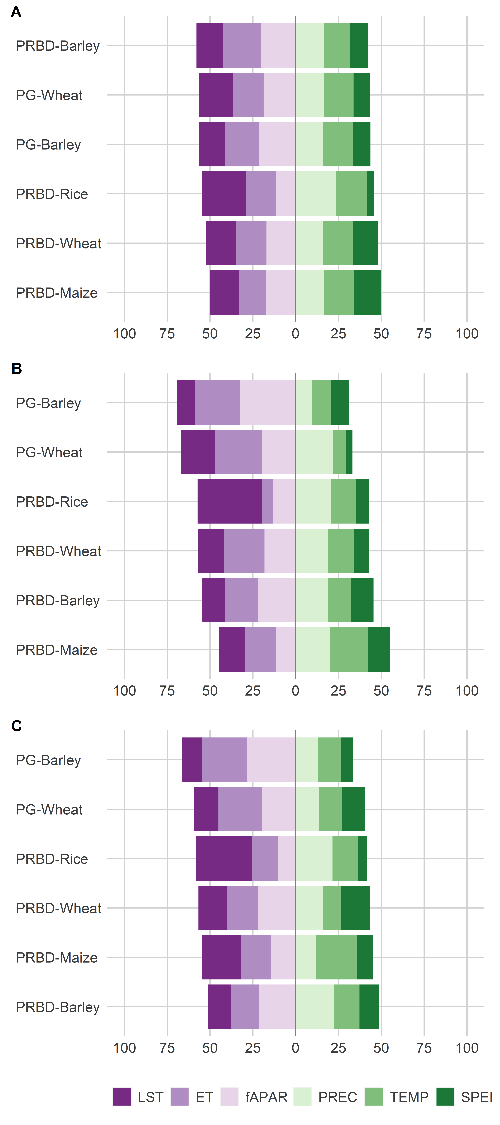
The predictive ability of several local‐scale statistical models for Italian cereal yields was tested in this study. Summer crops showed relatively better predictability than winter crops, irrespective of the model considered. This may be partly explained by a more intricate relation between winter cereals and excess water scenarios, and because some winter species are subject to different physiological processes, such as vernalization, neither of which is well captured by our predictors. Differences in the fit of wheat models in both regions could also respond to common and durum wheat reacting differently to weather variations. More complex models based on feature selection outperformed parsimonious models, evidencing the gains of combining climate and satellite information. These gains, however, decreased as yield and predictors were spatially aggregated. Within feature selection models, a preference for satellite‐based indicators was revealed, probably because their higher native resolution can better match local crop characteristics. We conclude, however, that feature selection from regularized models needs to be further explored, as it seems highly dependent on the total size of the regularization penalty. Finally, our results indicate that parsimonious models based on pure meteorological variables behave well in predicting cereal yields at coarse aggregation scales, but if finer levels of spatial detail are sought, combining information from different sources using; for instance, the regularization methods proposed in this study can improve the overall performance of crop yield forecasting tools.